Home
Validated at machine precision
Most reporting packages test that code runs. PySofra tests that numbers are correct.
A 54-step audit notebook runs against the 2017–18 US National Health and Nutrition Examination Survey and asserts 52 numerical contracts against independent R reference implementations — on every push to main.
| Quantity | Reference | Observed error |
|---|---|---|
| Weighted mean — Table 1 cell | gtsummary display value |
3.3 × 10⁻¹⁵ rel |
| Weighted SD — Table 1 cell | gtsummary display value |
3.8 × 10⁻¹⁵ rel |
| Weighted proportion (4 variables) | gtsummary display value |
4.6 × 10⁻¹⁵ rel |
| Survey regression SE (6 coefficients) | R svyglm |
< 0.8% rel |
| MI pooled point estimate | Rubin (1987) | < 10⁻¹⁴ abs |
| KM survival probability | lifelines | < 10⁻¹⁵ abs |
Weighted means and SDs agree with R at floating-point machine precision — not approximation. Nominal 95% CIs attain 94.2% and 93.8% empirical coverage in a 1,000-replicate Monte Carlo study.
The pre-executed audit notebook is readable without installing anything. See AUDITOR.md for the single-command reproduction recipe.
Features
-
Six table builders
tbl_one,tbl_summary,tbl_cross,tbl_regression,tbl_uvregression,tbl_survival— covering the full clinical-reporting stack in one coherent API. -
Seven output formats
HTML · Markdown · LaTeX · DOCX · PPTX · XLSX · PNG from a single immutable
SofraTableobject. Output is byte-identical across processes. -
Survey weights
SurveyDesign(weights=, strata=, cluster=)accepted by every builder. Taylor-linearised sandwich SEs, Rao–Scott adjusted test statistics. -
Multiple-imputation pooling
ps.pool(fits)applies Rubin's rules and returns an object accepted bytbl_regression— no manual bookkeeping. -
Safety diagnostics
with_safety_warnings()embeds separation, PH-violation, and sparse-cell footnotes directly into DOCX, HTML, and LaTeX output. -
Auto-dispatched tests
Welch, Wilcoxon, ANOVA, Kruskal–Wallis, Fisher, χ², Rao–Scott — selected per row by variable type, overridable per variable.
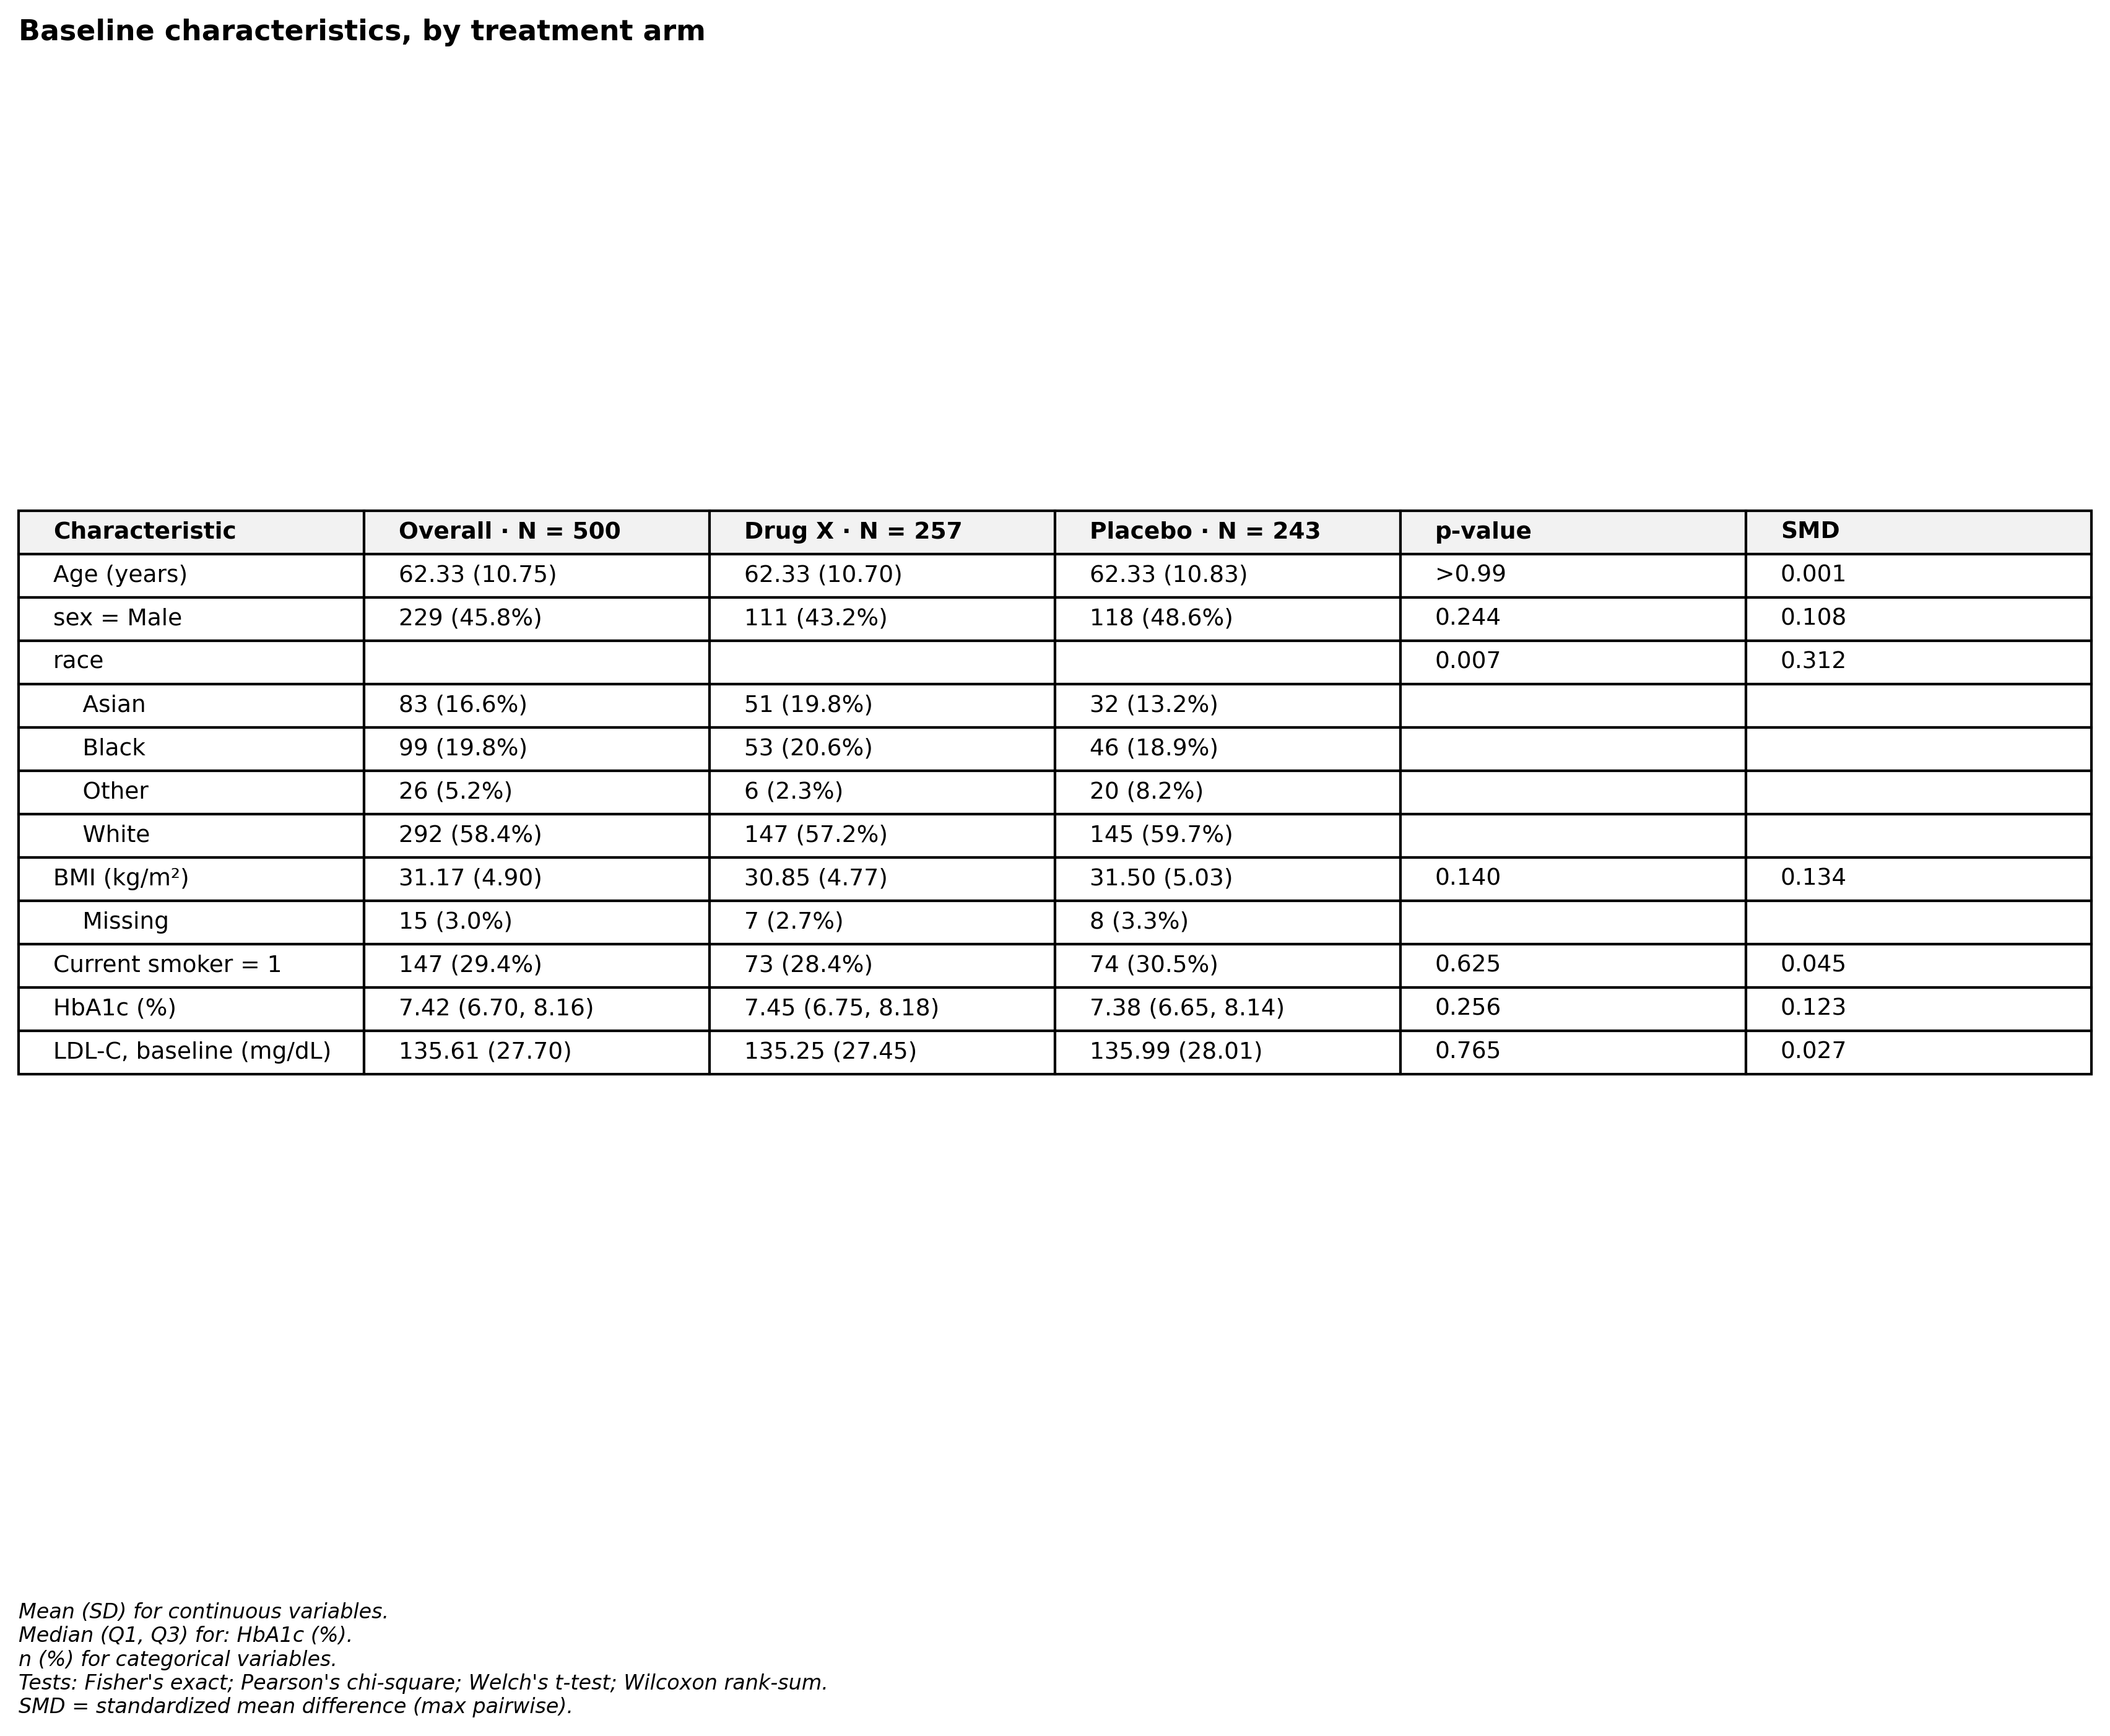
Quick example
import pysofra as ps

tbl = (
    ps.tbl_one(df, by="arm",
               labels={"age": "Age (years)", "bmi": "BMI (kg/m²)"},
               nonnormal=["bmi"])
      .add_p()
      .add_smd()
      .add_overall()
      .theme("clinical")
)

tbl                          # renders in Jupyter / VS Code / Colab
tbl.to_docx("table1.docx")   # publication-quality Word document
tbl.to_latex()               # LaTeX fragment, ready for manuscript